Published 2022. 4. 23. 00:02

📌 이 글은 권철민님의 딥러닝 컴퓨터 비전 완벽 가이드 강의를 바탕으로 정리한 내용입니다.
목차
- IoU (Intersection over Union)
- IoU에 따른 Detection 성능
- IoU 구하기 실습
Object Detection 성능평가 Metric
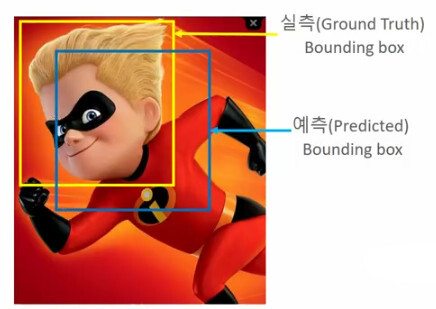
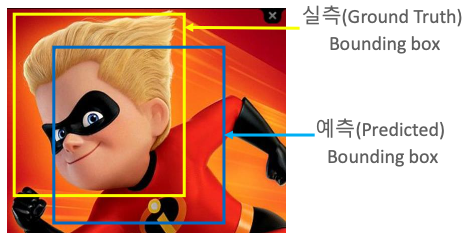
IoU (Intersection over Union)
- 모델이 예측한 결과와 실측(Ground Truth) Box가 얼마나 정확하게 겹치는가를 나타내는 지표
- 개별 Box가 서로 겹치는 영역 / 전체 Box의 합집합 영역
- Area of Overlap(교집합) / Area of Union(합집합)
IoU에 따른 Detection 성능
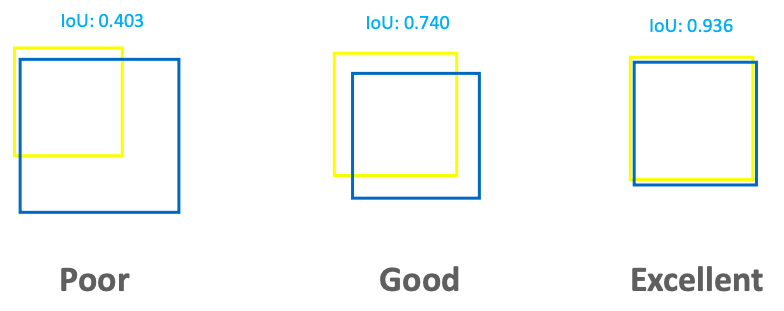
- poor : < 0.5
- good : > 0.5
- excellent : 상대적으로 높을 때(0.936)
- 그러나 IoU 기준을 어느정도에 잡느냐에 따라 다르다.
IoU 구하기 실습
입력 인자로 후보 박스와 실제 박스를 받아서 IOU를 계산하는 compute_iou 함수 생성
- GT와 cand의 x, y 좌표에서 min과 max 값 구하기
- x 좌표의 길이와 y 좌표의 길이를 통해 intersection의 넓이 구하기
- 합집합 연산을 통해 union 구하기
import numpy as np

def compute_iou(cand_box, gt_box):

  # Calculate intersection areas
  x1 = np.maxium(cand_box[0], gt_box[0])
  y1 = np.maxium(cand_box[1], gt_box[1])
  x2 = np.maxium(cand_box[2], gt_box[2])
  y2 = np.maxium(cand_box[3], gt_box[3])

  intersection = np.maximum(x2 - x1, 0) * np.maximum(y2 - y1, 0)

  cand_box_area = (cand_box[2] - cand_box[0]) * (cand_box[3] - cand_box[1])
  gt_box_area = (gt_box[2] - gt_box[0]) * (gt_box[3] - gt_box[1])
  union = cand_box_area + gt_box_area - intersection

  iou = intersection / union

  return iou
- Ground Truth 영역 그리기
import cv2
import matplotlib.pyplot as plt
%matplotlib inline

# 실제 box(Ground Truth)의 좌표를 아래와 같다고 가정
gt_box = [60, 15, 320, 420]

img = cv2.imread('./data/audrey01.jpg')
img_rgb = cv2.cvtColor(img, cv2.COLOR_BGR2RGB)

red = (255, 0, 0)
img_rgb = cv2.rectangle(img_rgb, (gt_box[0], gt_box[1]), (gt_box[2], gt_box[3]), color=red, thickness=2)

plt.figure(figsize=(8, 8))
plt.imshow(img_rgb)
plt.show()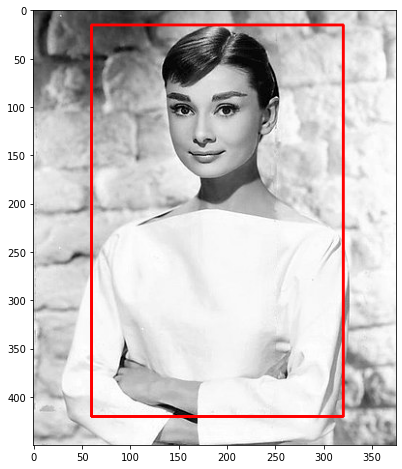
- 이미지의 Region Proposal 정보 가져오기
import selectivesearch

#selectivesearch.selective_search()는 이미지의 Region Proposal 정보를 반환
img = cv2.imread('./data/audrey01.jpg')
img_rgb2 = cv2.cvtColor(img, cv2.COLOR_BGR2RGB)

_, regions = selectivesearch.selective_search(img_rgb2, scale=100, min_size=2000)
- iou 결과 시각화
img = cv2.imread('./data/audrey01.jpg')
img_rgb = cv2.cvtColor(img, cv2.COLOR_BGR2RGB)
print('img shape: ', img.shape)

green_rgb = (125, 255, 51)
cand_rects = [cand['rect'] for cand in regions if cand['size'] > 3000]
gt_box = [60, 15, 320, 420]
img_rgb = cv2.rectangle(img_rgb, (gt_box[0], gt_box[1]), (gt_box[2], gt_box[3]), color=red, thickness=2)

for index, cand_box in enumerate(cand_rects):

  cand_box = list(cand_box)
  cand_box[2] += cand_box[0]
  cand_box[3] += cand_box[1]

  iou = compute_iou(cand_box, gt_box)

  if iou > 0.0026:
    print('index:', index, "iou:", iou, 'rectangle: ', (cand_box[0], cand_box[1], cand_box[2], cand_box[3]))
    cv2.rectangle(img_rgb, (cand_box[0], cand_box[1]), (cand_box[2], cand_box[3]), color=green_rgb, thickness=1)
    text = "{}: {:.2f}".format(index, iou)
    cv2.putText(img_rgb, text, (cand_box[0]+100, cand_box[1]+10), cv2.FONT_HERSHEY_SIMPLEX, 0.4, color=green_rgb, thickness=1)

plt.figure(figsize=(12,12))
plt.imshow(img_rgb)
plt.show()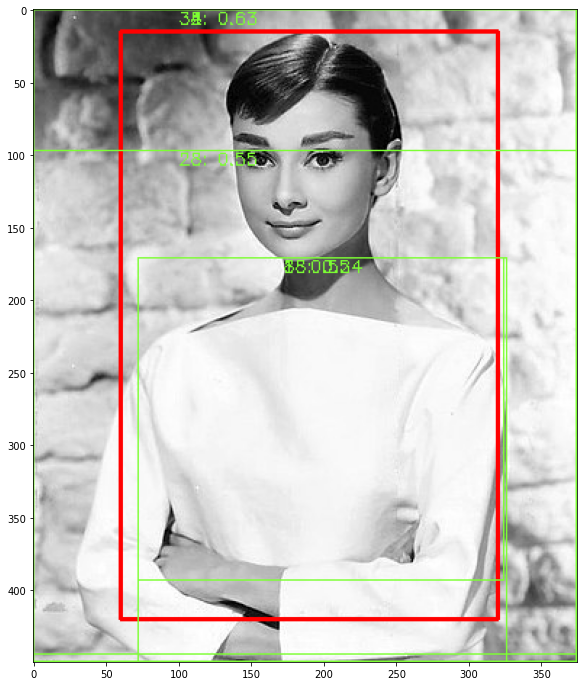
'🖼 Computer Vision > Object Detection' 카테고리의 다른 글
| CV - Object Detection 주요 데이터셋 (0) | 2022.04.23 |
|---|---|
| CV - OD 성능 평가 Metric - mAP (0) | 2022.04.23 |
| CV - NMS(Non Max Suppression) (0) | 2022.04.23 |
| CV - Selective Search로 Region Proposal 해보기 (0) | 2022.04.22 |
| CV - Object Detection의 이해 (0) | 2022.04.18 |