이미지 데이터 스케일링은 어떻게 진행되고 각 모델에 맞게 스케일링을 어떻게 해야할까?
목차
- Cat&Dog Data Load
- image data의 scaling preprocessing 유형
- tf 또는 torch 유형으로 변경하는 함수 생성
- scale 된 이미지 pixel값의 histogram 시각화
- 그러나 논문에 나와있는 pretrained 모델들은 고유한 scaling 방법이 있다 : preprocess_input()
- ImageDataGenerator에 preprocess_input()을 적용시 preprocessing_function 파라미터를 사용
1. Data Load
import numpy as np # linear algebra
import pandas as pd # data processing, CSV file I/O (e.g. pd.read_csv)

import os
for dirname, _, filenames in os.walk('/kaggle/input'):
    for filename in filenames:
        print(os.path.join(dirname, filename))
paths = []
dataset_gubuns = []
label_gubuns = []
# os.walk()를 이용하여 특정 디렉토리 밑에 있는 모든 하위 디렉토리를 모두 조사한다.
# cat-and-dog 하위 디렉토리 밑에 jpg 확장자를 가진 파일이 모두 이미지 파일이다.
# cat-and-dog 밑으로 /train, /test 하위 디렉토리가 존재한다.(학습, 테스트용 이미지 파일을 가진다.)

for dirname, _, filenames in os.walk('/kaggle/input/cat-and-dog'):
    for filename in filenames:
        # 이미지 파일이 아닌 파일도 해당 디렉토리에 있다.
        if '.jpg' in filename: # jpg 파일을 가지고 있다면
            # 파일의 절대경로를 file_path 변수에 할당한다.
            file_path = dirname+'/'+filename
            paths.append(file_path)

            # 파일의 절대 경로에 training_set, test_set이 포함되어 있으면 데이터셋 구분을 train, test로 분류한다.
            if '/training_set/' in file_path:
                dataset_gubuns.append('train')
            elif '/test_set/' in file_path:
                dataset_gubuns.append('test')
            else:
                dataset_gubuns.append('N/A')

            # 파일의 절대 경로에 dogs가 있을 경우 해당 파일은 dog 이미지이고 cat일 경우 cat 이미지 파일이다.
            if 'dogs' in file_path:
                label_gubuns.append('DOG')
            elif 'cats' in file_path:
                label_gubuns.append('CAT')
            else:
                label_gubuns.append('N/A')
pd.set_option('display.max_colwidth', 200)
data_df = pd.DataFrame({'path':paths, 'dataset':dataset_gubuns, 'label':label_gubuns})
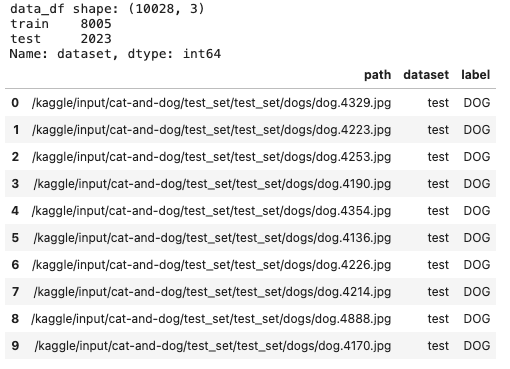
print('data_df shape:', data_df.shape)
print(data_df['dataset'].value_counts())
data_df.head(10)
# 개와 고양이의 이미지 파일 절대 경로를 cv2.imread()로 읽어서 image array로 로드하고 시각화
# 이미지별로 서로 다른 이미지 사이즈를 가지고 있다.
import matplotlib.pyplot as plt
import cv2
%matplotlib inline

def show_grid_images(image_path_list, ncols=8, augmentor=None, title=None):
    figure, axs = plt.subplots(figsize=(22,6), nrows=1, ncols=ncols)
    for i in range(ncols):
        image = cv2.cvtColor(cv2.imread(image_path_list[i]), cv2.COLOR_BGR2RGB)
        axs[i].imshow(image)
        axs[i].set_title(title)

# 강아지와 고양이인 것들의 path컬람을 가져와서 이미지 리스트를 만든다.
dog_image_list = data_df[data_df['label']=='DOG']['path'].iloc[:6].tolist()
show_grid_images(dog_image_list, ncols=6, title='DOG')

cat_image_list = data_df[data_df['label']=='CAT']['path'].iloc[:6].tolist()
show_grid_images(cat_image_list, ncols=6, title='CAT')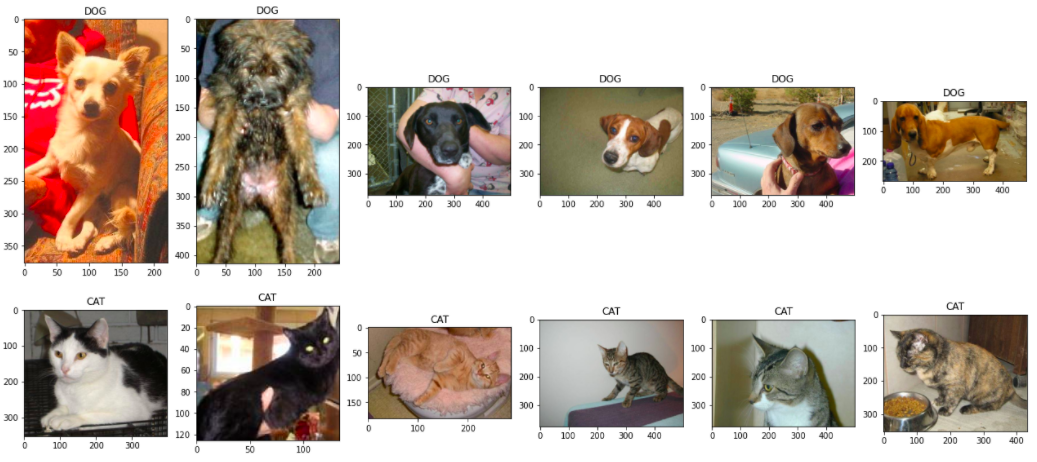
2. image data의 scaling preprocessing 유형
- 0 ~ 1 사이, -1 ~ 1 사이, z-score 변환 중에 선택한다.
- pretrained 모델은 주로 tf와 torch 프레임웍으로 생성된다.
- tf는 -1 ~ 1 로 변환.
- torch는 전통적으로 z-score 변환(0 ~ 1로 scaling 후 ImageNet 데이터 세트의 이미지 채널별 평균값, 표준편차값을 이용하여 z score 변환 적용)
import cv2

# 임의의 이미지 한개 선택.
image = cv2.cvtColor(cv2.imread(data_df['path'].iloc[0]), cv2.COLOR_BGR2RGB)
plt.imshow(image)
3. tf 또는 torch 유형으로 변경하는 함수 생성
def preprocessing_scaling(x, mode='tf'):
    if mode == 'tf': # 텐서플로우
        x = x/127.5
        x -= 1. # 여기까지하면 -1~1 값이 만들어진다.

    elif mode == 'torch': # 파이토치
        x = x/255. # 255로 나눠서 0~1 값으로 바꾼다.
        mean = [0.485, 0.456, 0.406] # 데이터의 평균이 아니라 imageNet의 평균이다.
        std = [0.229, 0.224, 0.225]

        x[:, :, 0] = (x[:, :, 0] - mean[0])/std[0]
        x[:, :, 1] = (x[:, :, 1] - mean[1])/std[1]
        x[:, :, 2] = (x[:, :, 2] - mean[2])/std[2]

    return x

scaled_image_tf = preprocessing_scaling(image, mode='tf')
scaled_image_torch = preprocessing_scaling(image, mode='torch')
4. scale 된 이미지 pixel값의 histogram 시각화
def show_pixel_histogram(image):
    fig, axs = plt.subplots(nrows=1, ncols=3, figsize=(16, 6))

    for i in range(3):
        # i값 0 일때 Red 채널, i값 1일때 Green Channel, i값 2일때 Blue Channel Histogram 표현
        axs[i].hist(image[:, :, i].flatten(), bins=100, alpha=0.5) # 사진 옵션들
        axs[i].legend(loc='upper right') # 어디에 달거냐
        if i==0:
            title_str = 'Red'
        elif i==1:
            title_str = 'Green'
        else:
            title_str = 'Blue'
        axs[i].set(title=title_str)

show_pixel_histogram(scaled_image_tf)
show_pixel_histogram(scaled_image_torch)
텐서플로우는 -1~1 변환 되었고, 토치는 z-score 변환 되었다. 그래서 -2~2 정도까지 간다.
전반적인 히스토그램 자체는 다르지 않다.
그럼 왜 이 방법으로 안해?
그냥 255.0 으로 나누는 것이 가장 편하다. 쉽다.
그냥 0~1로 변환하는게 편하다.
show_pixel_histogram(image/255.0)
5. 그러나 논문에 나와있는 pretrained 모델들은 고유한 scaling 방법이 있다.
케라스에서는 preprocess_input 만 갖다쓰면 그냥 알아서 바뀐다.
xception 모델
from tensorflow.keras.applications.xception import preprocess_input

# Xception의 scaling 방식은 tf : -1 ~ +1
scaled_image_xception = preprocess_input(image)
show_pixel_histogram(scaled_image_xception)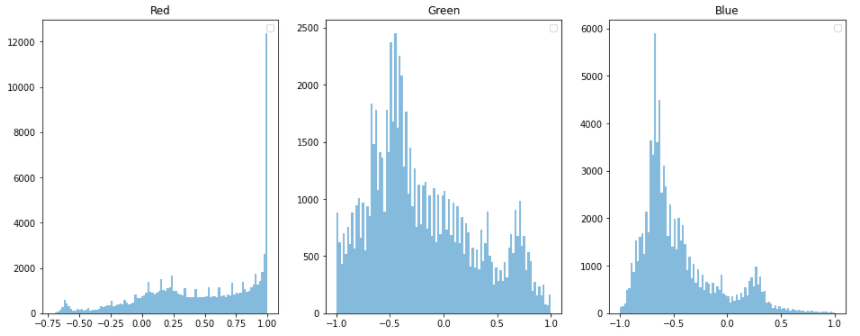
DenseNet 모델
from tensorflow.keras.applications.densenet import preprocess_input

# DenseNet의 scaling 방식은 torch 스타일
scaled_image_densenet = preprocess_input(image)
show_pixel_histogram(scaled_image_densenet)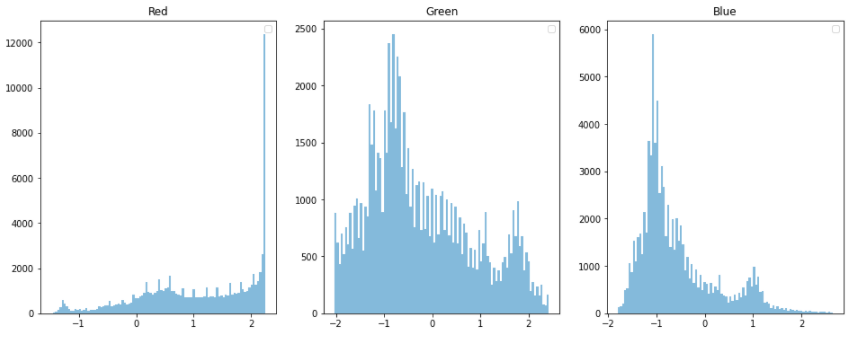
6. ImageDataGenerator에 preprocess_input()을 적용시 preprocessing_function 파라미터를 사용
from tensorflow.keras.applications.xception import preprocess_input

#tr_generator = ImageDataGenerator(horizontal_flip=True, rescale=1/255.)
tr_generator = ImageDataGenerator(horizontal_flip=True, preprocessing_function=preprocess_input)
tr_flow_gen = tr_generator.flow_from_dataframe(dataframe=tr_df # image file이 있는 디렉토리
                                      ,x_col='path'
                                      ,y_col='label'
                                      ,target_size=(IMAGE_SIZE, IMAGE_SIZE) # 원본 이미지를 최종 resize할 image size
                                      ,class_mode='binary' # 문자열 label을 자동 Encoding.
                                      ,batch_size=BATCH_SIZE
                                      ,shuffle=True
                                      )
images_array = next(tr_flow_gen)[0]
labels_array = next(tr_flow_gen)[1]

show_pixel_histogram(images_array[0])
'🖼 Computer Vision > CNN' 카테고리의 다른 글
| CNN - VGGNet (0) | 2022.04.01 |
|---|---|
| CNN - AlexNet (0) | 2022.03.31 |
| OpenCV 이미지 로딩시 BGR을 RGB로 변환해야 하는 이유 (0) | 2022.03.27 |
| CNN - Data Augmentation (0) | 2022.03.04 |
| CNN - Global Average Pooling (0) | 2022.03.04 |